2024 automotive sale and services statistics
Occupations
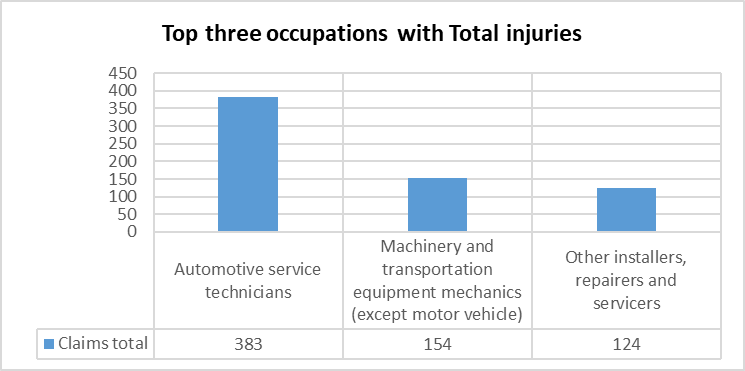
| Top three occupations with Total injuries | Total | Percentage |
| Automotive service technicians | 383 | 32.02% |
| Machinery and transportation equipment mechanics (except motor vehicle) | 154 | 12.88% |
| Other installers, repairers and servicers | 124 | 10.37% |
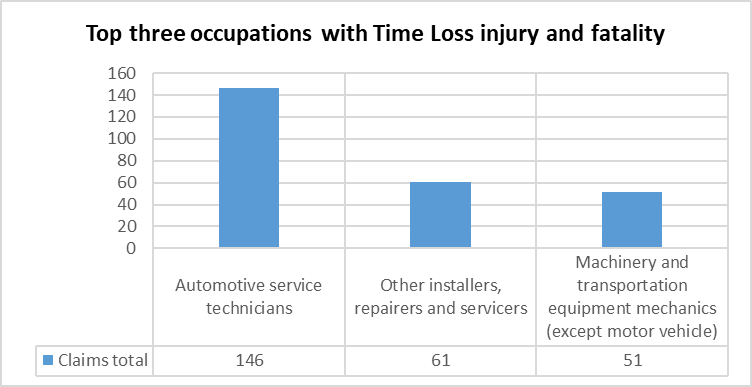
| Top three occupations with Time Loss injury and fatality | Total | Percentage |
| Automotive service technicians | 146 | 31.06% |
| Other installers, repairers and servicers | 61 | 12.98% |
| Machinery and transportation equipment mechanics (except motor vehicle) | 51 | 10.85% |
Causes
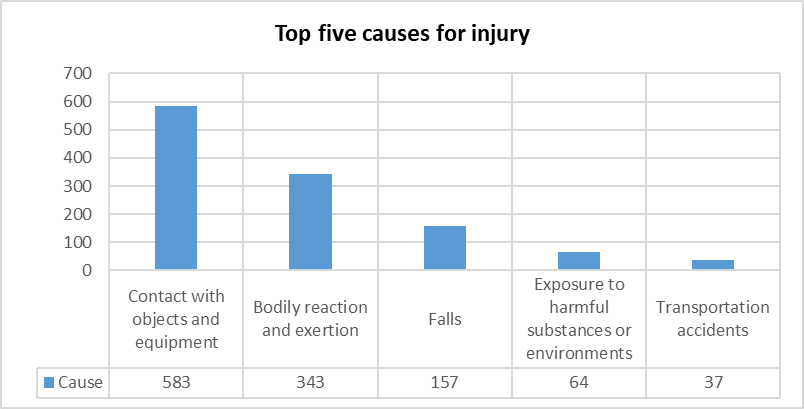
| Top five causes for injury | Claims total | Percentage |
| Contact with objects and equipment | 583 | 48.75% |
| Bodily reaction and exertion | 343 | 28.68% |
| Falls | 157 | 13.13% |
| Exposure to harmful substances or environments | 64 | 5.35% |
| Transportation accidents | 37 | 3.09% |
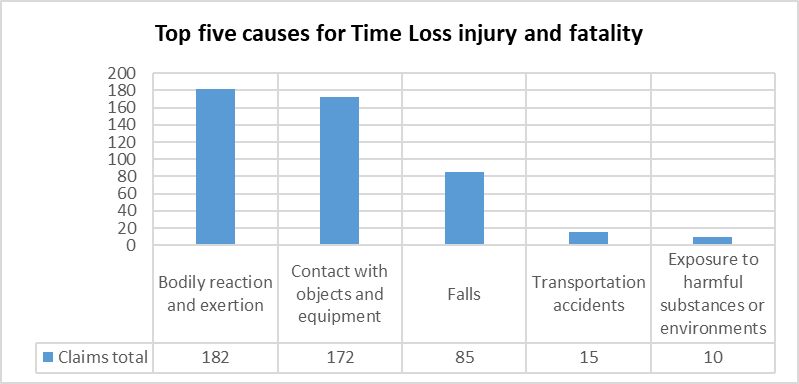
| Top five causes for Time Loss injury and fatality | Claims total | Percentage |
| Bodily reaction and exertion | 182 | 38.72% |
| Contact with objects and equipment | 172 | 36.60% |
| Falls | 85 | 18.09% |
| Transportation accidents | 15 | 3.19% |
| Exposure to harmful substances or environments | 10 | 2.13% |
Body parts
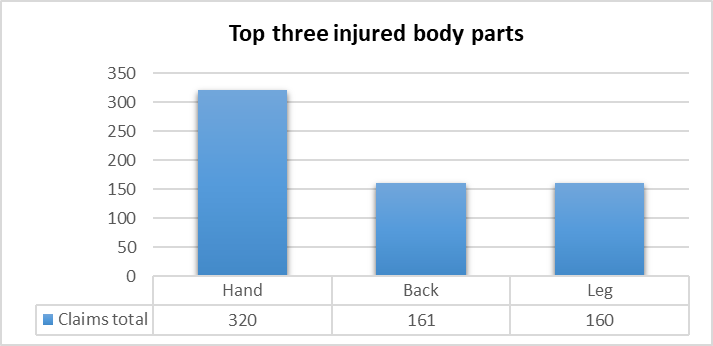
| Top three injured body parts | Claims total | Percentage |
| Hand | 320 | 26.76% |
| Back | 161 | 13.46% |
| Leg | 160 | 13.38% |
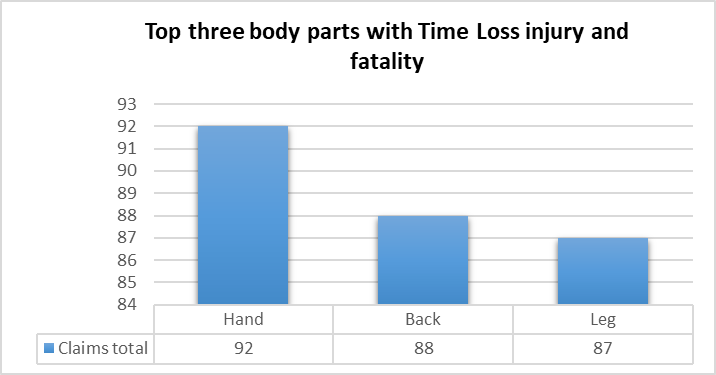
| Top three body parts with Time Loss injury and fatality | Claims total | Percentage |
| Hand | 92 | 19.57% |
| Back | 88 | 18.72% |
| Leg | 87 | 18.51% |
| Most common causes | Claim per cent | Comment |
| Contact with objects and equipment is the most common cause of injury. | 49.57% | of these injuries are to hand. The most common of these injuries are due to struck by swinging or slipping object such as cutting hand tools – non-powered. |
| Contact with objects and equipment is the most common cause of injury. | 14.75% | of these injuries are to head. The most common of these injuries are due to struck against stationary object such as truck. |
| Contact with objects and equipment is the most common cause of injury. | 9.95% | of these injuries are to eye. The most common of these injuries are due to struck by flying object such as chips, particles, splinters. |
| Bodily reaction and exertion is the other major cause of injury. | 37.32% | of these injuries are to back. The most common of these injuries are due to overexertion in lifting such as tires, inner tubes, wheels. |
| Bodily reaction and exertion is the other major cause of injury. | 21.57% | of these injuries are to leg. The most common of these injuries are due to slip, trip, twisting, stepped on or in, loss of balance – without fall such as bodily motion or position of injured, ill worker. |
| Bodily reaction and exertion is the other major cause of injury. | 13.41% | of these injuries are to shoulder. The most common of these injuries are due to overexertion in lifting such as boxes, crates, cartons. |